Bioinformatics software – particularly dealing with sequences – is dominated by command line tools. Sadly these are written in a plethora of different languages meaning that analysis pipelines are a mish-mash of Java Jars, interpreted Perl, Ruby, or Python scripts, plus compiled C/C++ standalones usually piped together by Bash scripts. Whilst these are mostly efficient they sometimes fail in the unix design philosophy of doing one simple thing very well. Rather they often do lots of overlapping things in undocumented ways. Installing, maintaining and using them together can be a bit of a pain.
In R meanwhile there is an excellent set of Bioconductor packages that lend a unified framework for dealing with sequences. There are many packages for applications like ChIP-seq or RNA-seq when the data is already aligned and summarised. There are less great tools for processing unaligned sequence data. Mostly this is because there is so much of it – R just doesn’t handle large datasets that well – though the Bioconductor developers have made heroic strides in managing memory outside base R.
The Bioconductor ShortRead package does handle some quality control (QC). It doesn’t do everything I want though and the underlying code is in C – which I for one find difficult to hack. So I decided to write the functionality of the FastQC and trimmomatic in R and C++ (using Rcpp and the Seqan C++ library)…. for fun. The next few posts will show the functions
Quality By Cycle
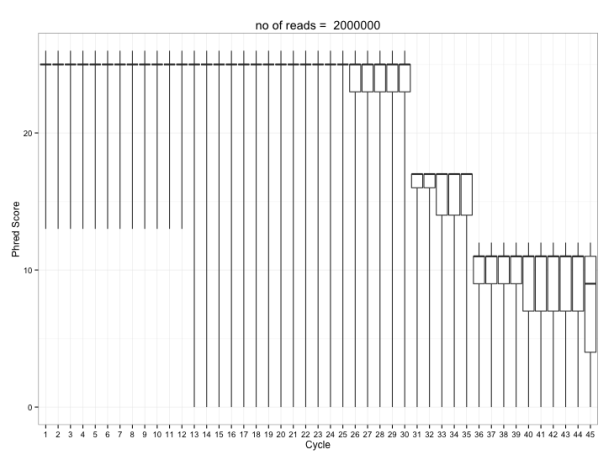
This first post show code for the most important FastQC graph – what they call “per base sequence quality” – and I call “quality by cycle”. High throughput sequences are “read” from left to right in repeated photochemical cycles of declining quality. So when reads get too long the error rate becomes unacceptably high. Usually this is the main diagnostic used to select the ‘trimming’ length for reads before subsequent analyses.
This “quality” is coded in the reads fastq files by a character code knowna as a Phred Score phred quality scores (Q) per base. Where P is the base calling error probability:
\( Q = -10\log_{10}P \)
Here are 4 lines of fastq: an ID, the DNA sequence, a separator line, and the Phred Score:
@SRR031709.1 HWI-EAS299_4_308T2AAXX:6:1:901:1978/1
GTTTCATAATTTAGATGGTTCGGGAAGTTAAACAATATGCGTAAA
+
:::::::::::::::::::::7::::::::/2222-,,,,,-,,(
Here then is the R code for qualByCycle which as the name implies creates a boxplot of the quality scores by cycle using ggplot2.
qualByCycle = function(fastqFile)
  {
  require(RcppArmadillo)
  require(ggplot2)

  # This is the C++ function
  boxStats = qualByCycleCpp(fastqFile)

  # just some tidying and labels
  boxStatsFrame = boxStats$fivenum
  boxtitles = paste('no of reads = ', boxStats$Reads)
  boxStatsFrame= t(boxStatsFrame)
  colnames(boxStatsFrame)=c('min', 'Q1', 'median', 'Q3', 'max')
  boxStatsFrame=as.data.frame(boxStatsFrame)
  boxStatsFrame$Cycle=factor(1:45)

  # make a plot
  g <- ggplot(boxStatsFrame, aes(x = Cycle, ymin = min, lower = Q1, middle = median, upper = Q3, ymax = max))
  g + geom_boxplot(stat = "identity")+theme_bw()+labs(list(title=boxtitles, y= 'Phred Score'))
}
And it gives something like this:
I’m using Rcpp + RcppArmadillo + C++ seqan to calculate quality summaries. C++ (can sometimes) handle big chunks of memory better than R. You could do some of this reading in fastq data into R using ShortRead, make a matrix of qualities then a boxplot. But for really big matrices e.g. >106 by 75 making a boxplot chokes an average desktop computer. Alternatively you could try the R fivenum() function (min, Q2, median, Q3, max) to calculate summary statistics for each cycle and plot these directly. This too chokes on a big matrix.
So you could pass the data out to a C++ function using Rcpp and calculate the fivenum summaries…better. Indeed a similar programming strategy is employed in Hadley Wickhams forthcoming (?) bigVis package. Regardless calculating fivenum is always going to be a cpu chore as whilst stats such as mean, min, max can be computed by a one pass read through an array (cycle columns in this case), Q1, median and Q3 imply sorting all values.
However reading the fastq file into R memory using Shortread and converting to a matrix before passing to Rcpp is also a memory/cpu hog. Better to do it all in C++ outside R then import just the summary data for plotting. For this I employ the outstanding sequence analysis C++ seqan library for the heavy lifting. In particular I use this due to it’s memory mapping which I’ll talk about more in subsequent posts….
Whilst I only really need R for the plotting – the Rcpp “Sugar” and RcppArmadillo packages are really useful too for simplifying C++ maths code. I’m not too proud of the following code… It analyses 2 million reads in ~10 secs on my oldish mac desktop with 4GB RAM and 2 cpu cores. It will happily work on >6 million reads without disk churn. There are some glaring inefficiencies… but it is convenient… for now.
#include <seqan/sequence.h>
#include <iostream>
#include <seqan/file.h>
#include <seqan/seq_io.h>
#include <RcppArmadillo.h>

using namespace Rcpp;
using namespace seqan;

// [[Rcpp::depends(RcppArmadillo)]]
// [[Rcpp::export]]

List qualByCycleCpp(std::string argv)
{

 // Open memory mapped string.
    seqan::String<char, seqan::MMap<> > mmapString;
    if (!open(mmapString, argv.c_str(), seqan::OPEN_RDONLY))
        return 1;  // Could not open file.

    // Create RecordReader.
    seqan::RecordReader<seqan::String<char, seqan::MMap<> >,
                        seqan::DoublePass<seqan::Mapped> > reader(mmapString);

    // Read file in two pass into optimised memory space
    seqan::StringSet<seqan::CharString> quals; // this persists
    {
    // ids and seqs are not used so I let go out of scope to free up memory -- HAXXXOR!
    seqan::StringSet<seqan::CharString> ids;
    seqan::StringSet<seqan::CharString > seqs;
    if (read2(ids, seqs, quals, reader, seqan::Fastq()) != 0)
        return 1;  // Could not read file.
    }

    //A Dna5q Stringset Iterator
    typedef Iterator<StringSet<CharString> >::Type TStringSetIter;
    TStringSetIter qualIt;

    seqan::CharString qual;
    qualIt = begin(quals);                       // point to first Phred String of Stringset
    const unsigned numcycles = length(*qualIt);  // get the number of cycles i.e. readlength
    const unsigned numreads = length(quals);    // length of the StringSet, number of reads

    // for boxplots by cycle a matrix sort is necessary you cant compute median etc on the stream.
    // Rcpp Armadillo matrices
    arma::mat qualMatrix = arma::mat(numreads, numcycles);
    qualMatrix.zeros();
    unsigned armaCounter = 0;

    for( ; qualIt != end(quals); ++qualIt, ++armaCounter) // this puts the seq data into the arma format
    {
      qual = *qualIt;

      for(unsigned cycle = 0; cycle< numcycles; ++cycle)
      {
        // a matrix of quality scores
        qualMatrix(armaCounter, cycle) = (int)ordValue(qual[cycle])-33;

      }

    }// is there a quick way to get seqs into arma::matrix?

    // I sort the columns (cycles) then calculate fivenum for each cycle (column)
    qualMatrix= sort(qualMatrix,0,0);
    int q1 = numreads/4;
    int mid = numreads/ 2; // Euclidian division
    int q3 = q1*3;
    NumericMatrix fivenum(5,numcycles);
    for (unsigned cycle = 0; cycle < numcycles; ++cycle)
    {

        fivenum(0,cycle) = qualMatrix(0,cycle);
        fivenum(1,cycle) = qualMatrix(q1,cycle);
        fivenum(2,cycle) = qualMatrix(mid,cycle);
        fivenum(3,cycle) = qualMatrix(q3,cycle);
        fivenum(4,cycle) = qualMatrix(numreads-1,cycle);
    }

return List::create(Named("File")   = argv,
                      Named("Reads")   = numreads,
                      Named("fivenum")  = fivenum);
}
NEXT TIME: FastQC style “per Sequence Quality Score” – and a bit more about Seqan.